
Have you ever heard of the “champagne glass of wealth”? This term describes how wealth is distributed worldwide.
In college, my favorite class was a sociology course about social inequality.
There was no political agenda behind the curriculum; rather, it looked at the hard facts and objective truth of inequality in the U.S. and worldwide.
As you can imagine, the coursework was not particularly cheery—but its takeaways have long stayed with me since graduating college.
Given the course’s topic, income, wealth, and poverty featured prominently in our lectures and discussions. And one of the concepts that stuck out to me most was the champagne glass distribution of wealth.
What is the champagne glass distribution of wealth?
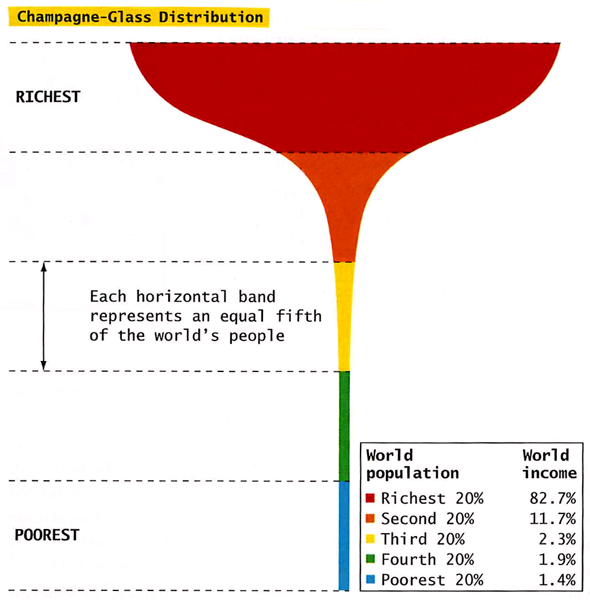
The champagne glass distribution of wealth is a visual framing of the world’s distribution of wealth.
Here’s the general idea behind it: if you divided the world’s population into five groups based on their amount of wealth, the richest 20% would hold over 80% of the world’s wealth. The poorest 20% would hold roughly 1%.
What about the distribution of wealth in the U.S.?
The U.S. Census Bureau has also looked at the distribution of wealth in the U.S. by quintile, albeit in terms of median household net worth. In 2011, the numbers were as follows:
| Quintile | Median Household Net Worth |
| Richest 20% | $630,754 |
| Second 20% | $205,985 |
| Third 20% | $68,839 |
| Fourth 20% | $7,263 |
| Poorest 20% | -$6,029 |
Note that the poorest 20% of American households have a negative net worth, meaning their total debt outweighs all that they own. Of course, because this figure is the median, half of the households in this quintile possess an even lower net worth in actuality.
Why does this matter?
Financial illiteracy is a major issue in the U.S., with personal finance education (or lack thereof) a central part of it.
If you’re not convinced, take a look at the U.S.’s latest personal finance statistics. Although wages, employment, and other economic factors affect these stats, the average American would likely be in better financial shape had they received some foundational course in personal finance.
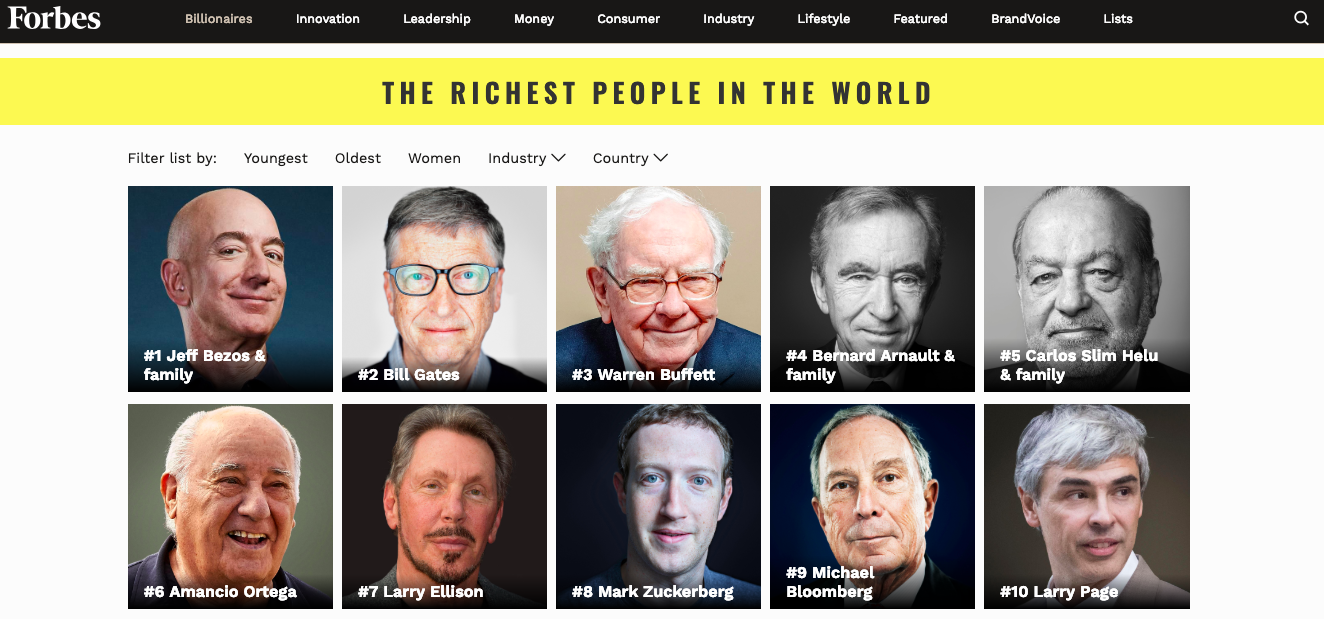
On that note, understanding larger issues related to wealth and money can help people better understand personal finance, especially since popular media tends to cover this topic quite regularly—take Forbes’ annual List of the Richest People in the World, for example.
Knowing about the champagne glass distribution of wealth also helps to provide some new perspective. According to a 2011 study, misperceptions of the level of wealth inequality in the U.S.—for instance, who exactly makes up the “middle class”—make it harder to agree on issues like taxation and welfare.
In fact, when tasked with drawing up diagrams of ideal wealth distribution, respondents in the study tended to agree on what “ideal” looked like. There was a large consensus, even from the wealthy participants, for a more equitable distribution, with a desire for the richest quintile to own 32% of all wealth (as opposed to over 80%).
That said, learning about the champagne glass of wealth has big benefits for framing larger political discussions and shaping personal finance curruicula in the future.
I love the analogy of the wealth distribution to a champagne glass. Just like with renewable energy, I think it is going to take many different solutions and approaches to begin to solve this. It is always interesting to hear the wealthy voicing their concerns about it as well, but it is hard for them to brainstorm solutions as well.
Absolutely. There isn’t a clear or easy solution for reducing wealth inequality, but it’ll be interesting to see whether the distribution becomes more even or uneven in later years. I’m curious how personal finance education would affect it, if at all.